
Klustron Online Elastic Scaling with Flow Control
Klustron Online Elastic Scaling with Flow Control
Note:
Unless specifically stated otherwise, the version numbers mentioned in the text can be substituted with any released version number. For a list of all released versions, please visit: Release_notes
Article Overview:
The Klustron database features a cluster architecture that allows both its compute and storage nodes to be capable of on-demand online scaling to accommodate increasing demands in computing power and storage capacity. After expanding the storage nodes, there is usually some data redistribution. Essentially, this involves data being exported from one shard and imported into another, a process akin to table migration. To minimize the impact on ongoing business operations, Klustron supports flow control during this migration process. This means that the bandwidth used in the transfer of data tables between nodes is regulated. Database administrators can accordingly adjust the flow control settings as needed. This article aims to demonstrate the setting process through simulated tests and illustrate how business operations remain uninterrupted during table migration. Additionally, it explores the effects of varying flow control parameters on business operations.
01 Preparing the Environment
In the test scenario described in this article, 4 servers are used. Three of these are dedicated to the Klustron database environment, while the fourth server is set up to run sysbench, simulating an active online business workload. The details of each server are as follows:
| Name | IP | Notes |
|---|---|---|
| Compute Node | 192.168.0.155 | |
| Storage Node 1 | 192.168.0.152 | |
| Storage Node 2 | 192.168.0.153 | |
| Business Load Simulation | 192.168.0.19 | Running sysbench |
1.1 Klustron Installation and Configuration
[Details Omitted]
1.2 Klustron Instance Environment Overview:
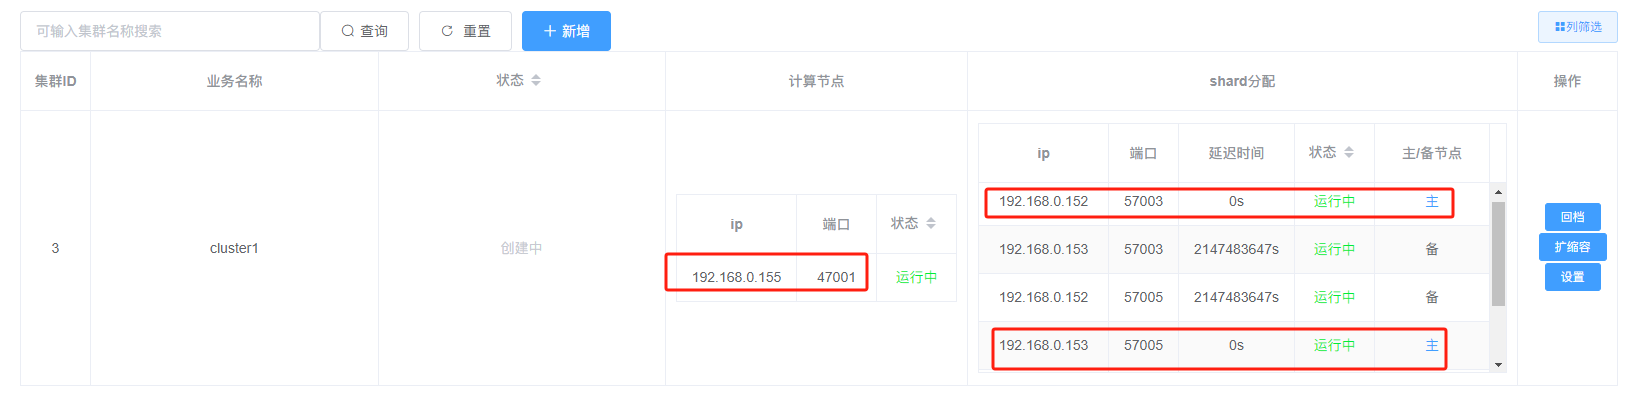
XPanel: http://192.168.0.155:40180/KunlunXPanel/#/cluster
Compute Node: 192.168.0.155, Port: 47001
Storage Node (shard1): 192.168.0.152, Port: 57003 (Primary)
Storage Node (shard2): 192.168.0.153, Port: 57005 (Primary)
Klustron is installed under the 'kl' user.
1.3 Creating a Test User
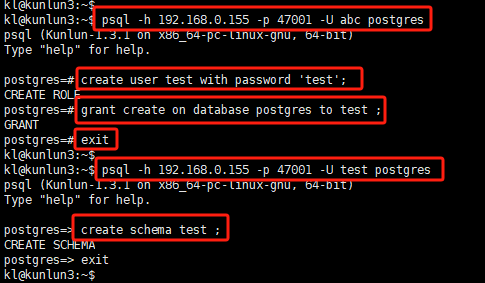
Using an SSH client, connect to the compute node and create a test user by executing the following commands:
psql -h 192.168.0.155 -p 47001 -U adc postgres
create user test with password 'test';
grant create on database postgres to test ;
exit

psql -h 192.168.0.155 -p 47001 -U test postgres
create schema test ;
_
1.4 Sysbench Installation and Configuration
[Details Omitted]
Note: By default, sysbench does not support testing for PostgreSQL and requires recompilation.
02 Online Table Migration and Flow Control Test
2.1 Creating Sysbench Test Data
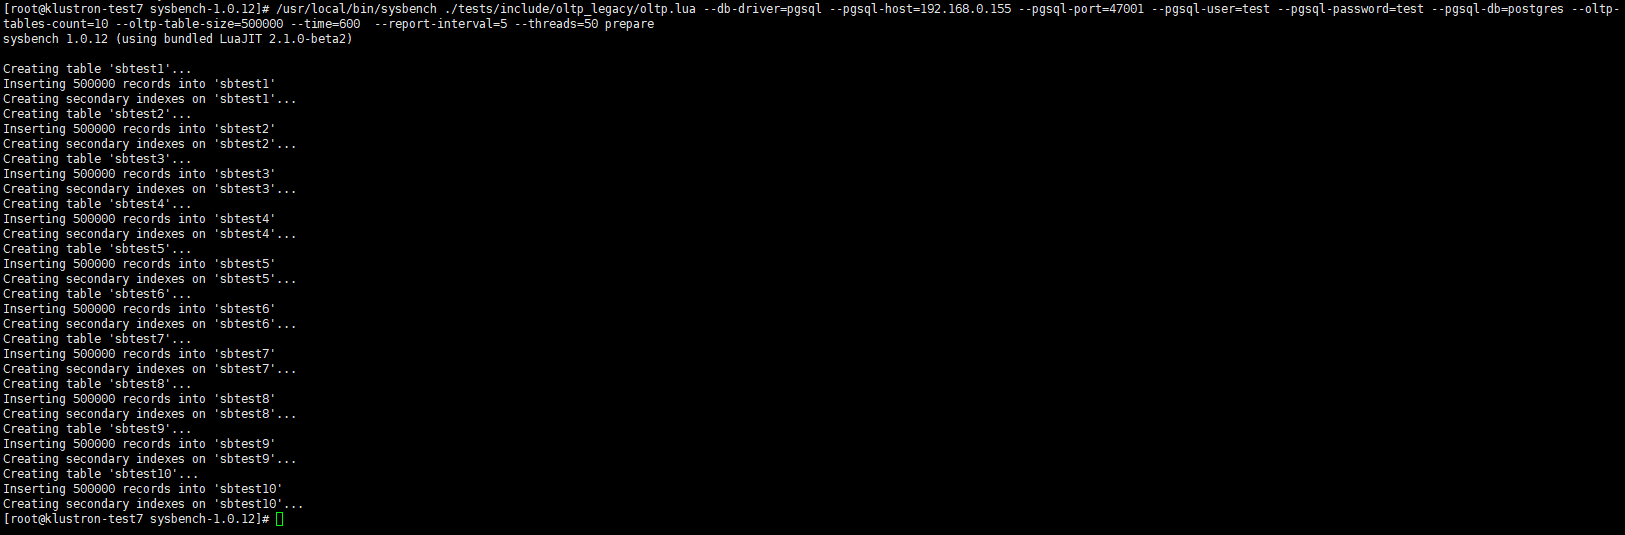
Connect to the business load simulation server using an SSH client and execute the following command:
/usr/local/bin/sysbench ./tests/include/oltp_legacy/oltp.lua --db-driver=pgsql --pgsql-host=192.168.0.155 --pgsql-port=47001 --pgsql-user=test --pgsql-password=test --pgsql-db=postgres --oltp-tables-count=10 --oltp-table-size=500000 --time=600 --report-interval=5 --threads=50 prepare
_
Note: For this test, to simulate a realistic business workload, the selected sysbench testing mode is OLTP, which includes both read and write operations on the database.
2.2 Checking the Distribution of Sysbench Data Tables
After the test data initialization in the previous step, sysbench has created 10 tables in Klustron. We can understand the distribution of these 10 tables across the two shards using XPanel, as follows:
Open XPanel and click on "Scaling".
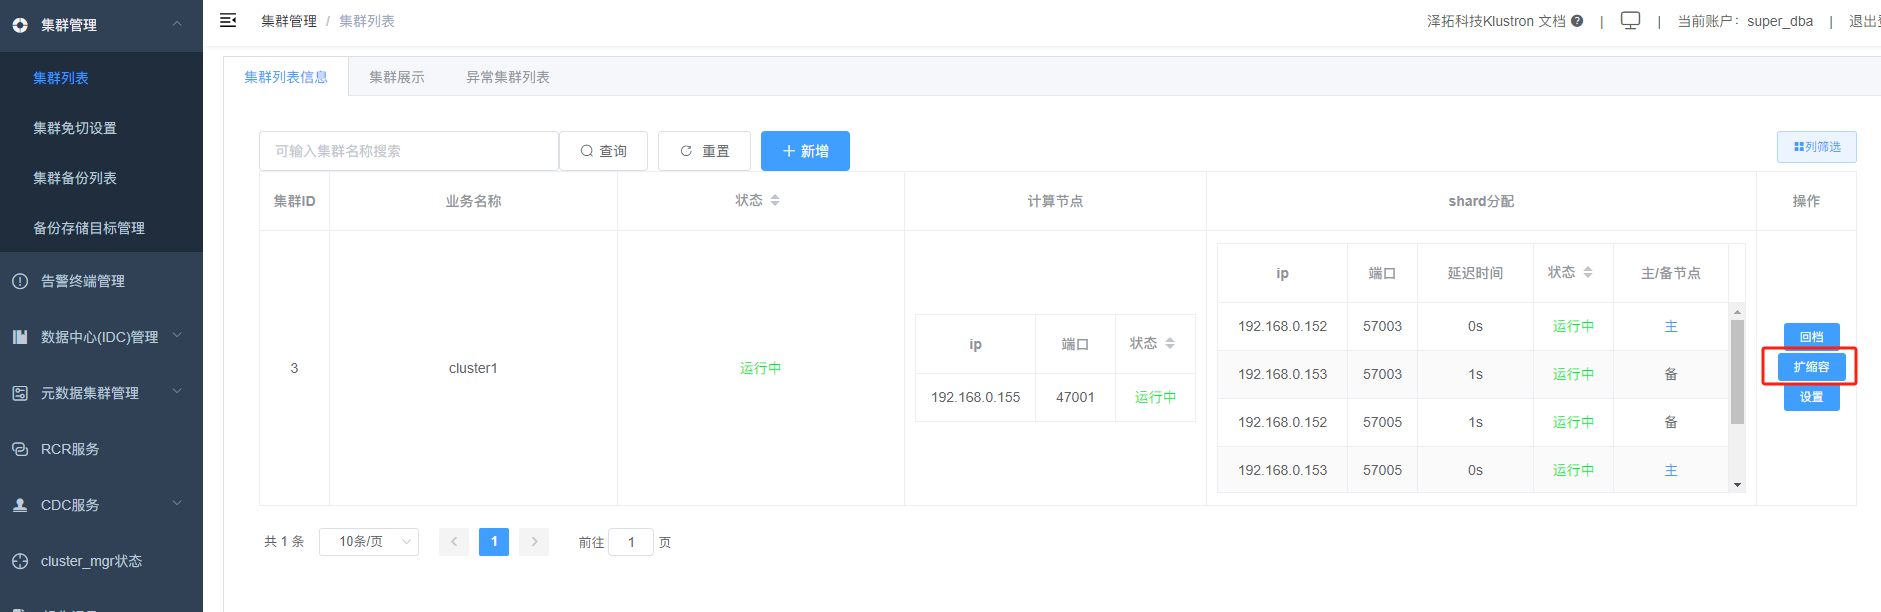
Select the database: postgres, and click "Confirm".

The dialog box that appears will show that tables sbtest3, sbtest5, sbtest7, and sbtest9 have been automatically assigned to shard_1.
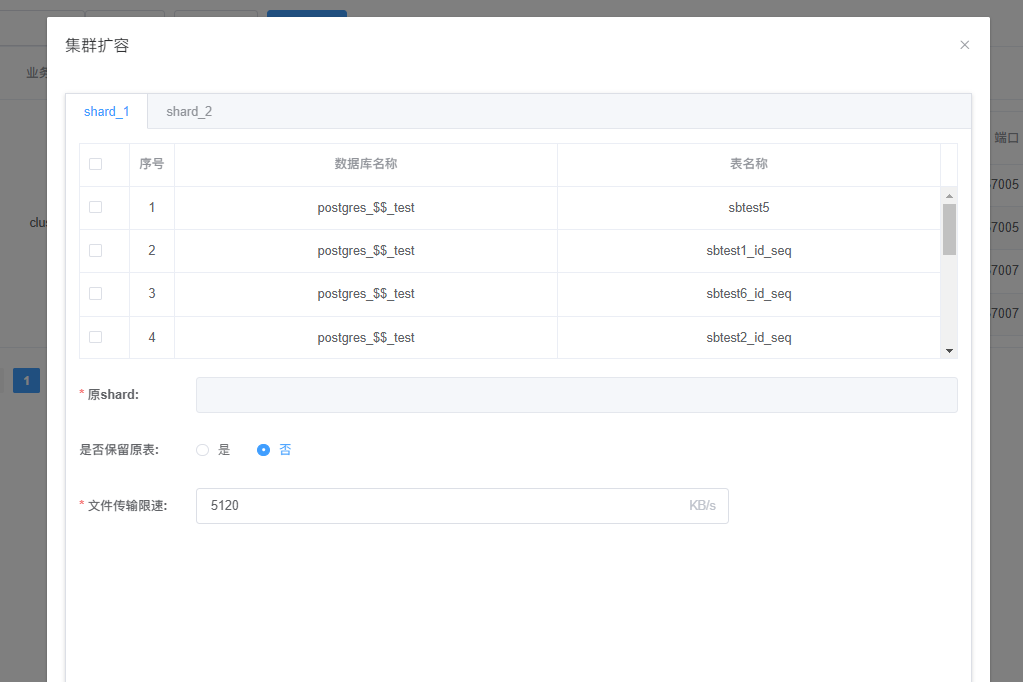
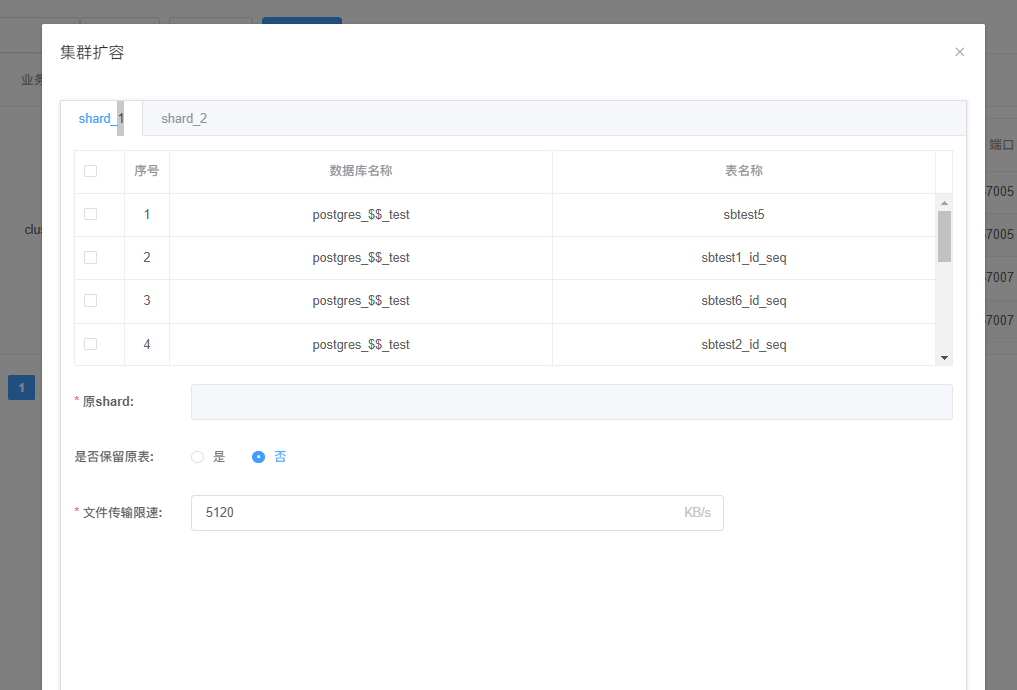
By selecting “shard_2”, you can see that the remaining tables: sbtest1, sbtest2, sbtest4, sbtest6, sbtest8, and sbtest10, have been automatically placed in shard_2.
2.3 Initiating the Sysbench Business Load
Execute the following command to send a mixed read-write load to the Klustron database:
/usr/local/bin/sysbench ./tests/include/oltp_legacy/oltp.lua --db-driver=pgsql --pgsql-host=192.168.0.155 --pgsql-port=47001 --pgsql-user=test --pgsql-password=test --pgsql-db=postgres --oltp-tables-count=10 --oltp-table-size=500000 --time=600 --report-interval=5 --threads=50 run
2.4 Online Table Migration Test
Once sysbench is running, pay attention to its output, as illustrated below:

Under the current load of 50 concurrent users, the TPS/QPS is observed to average around 600/11500, with the 95th percentile response latency averaging about 100ms.
Connect to the compute node and use the following command to monitor the server’s resource status:
top d 1
You can observe that the CPU utilization is around 50%, and there is no significant IO queuing:

Connect to one of the storage shards, shard_2, and use the following command to observe the resource status of this storage server:
top d 1
It is noted that the idle CPU resources are reduced to approximately 50%, and the IO wait time is considerably high:

To monitor the IO situation, use the following command:
iostat -dx -p /dev/sdb 3
Here, the IO utilization reaches 100%, and IO request queuing is observed, indicating that the IO bandwidth of the machine is fully utilized:
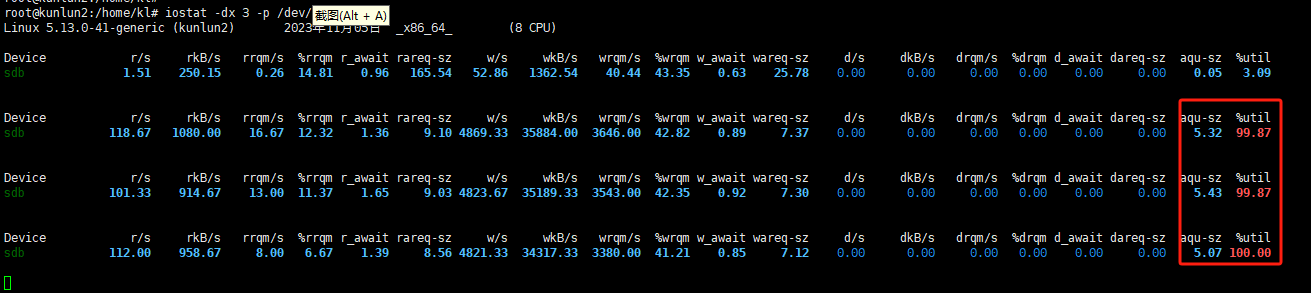
Similarly, by using the same method on storage shard_1, a similar situation can be observed:

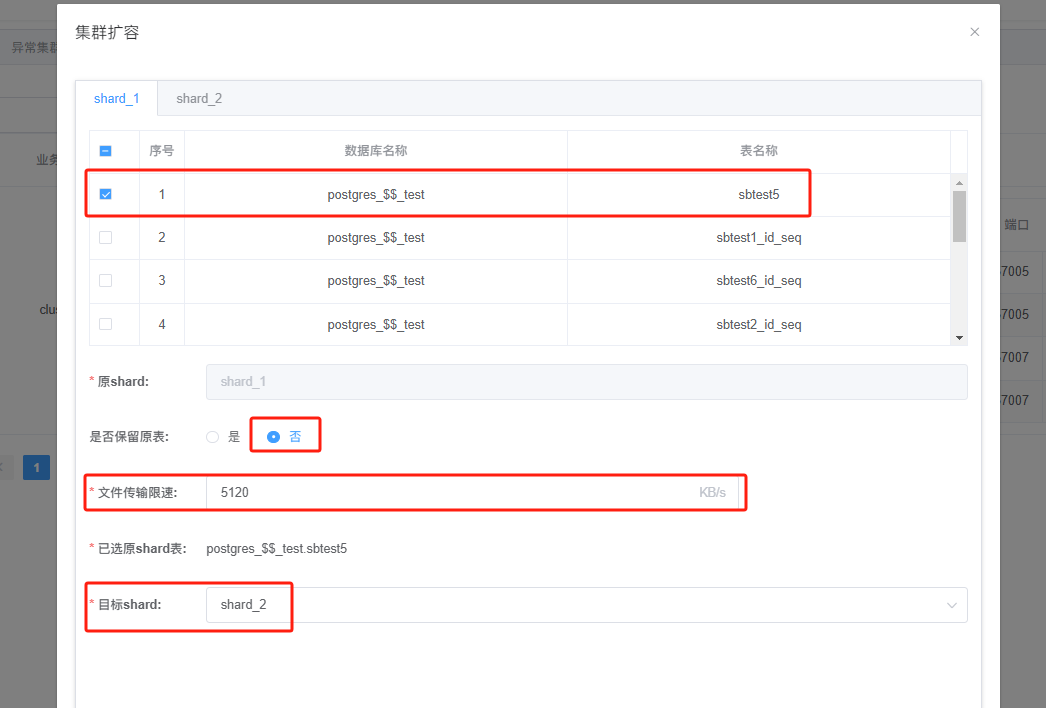
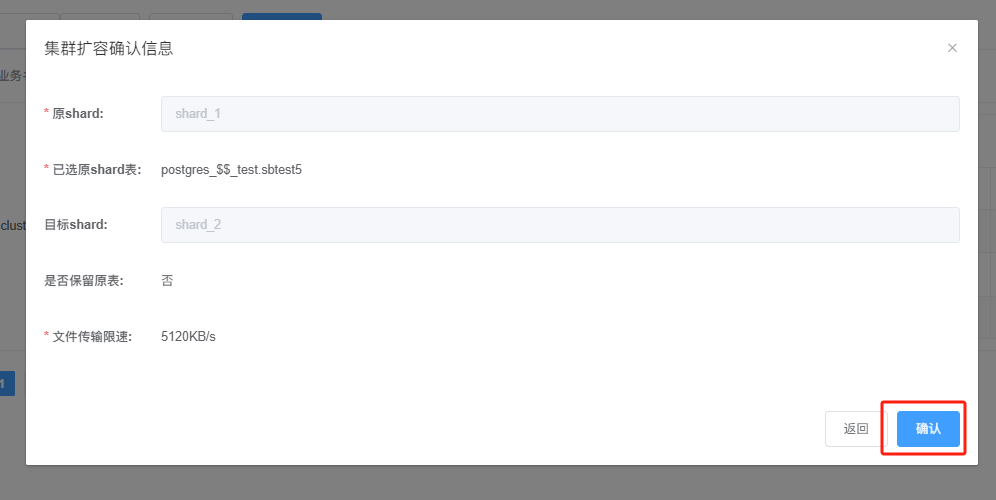
Return to XPanel, select the data table sbtest5 from shard_1. Choose 'No' for "Keep the Original Table?" and select shard_2 as the target shard, as shown:
Click "Confirm." The system prompts for reconfirmation, click "Confirm" again, as displayed below:
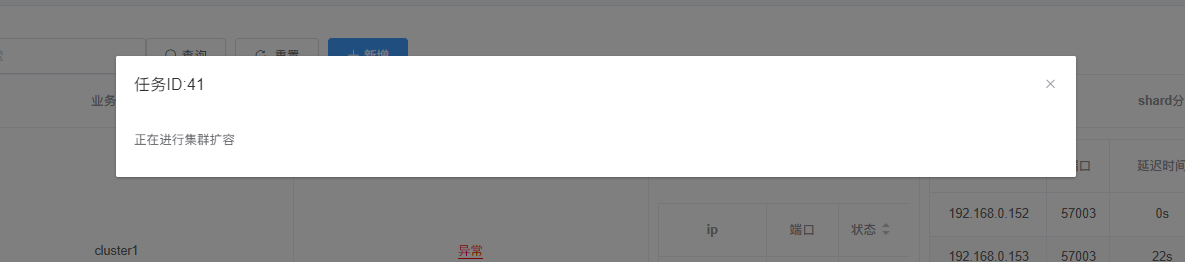
After confirming, Klustron initiates the online migration of sbtest5, as shown:
Returning to the sysbench output window, it is evident that the tps/qps values change following the initiation of the table migration, as indicated below:
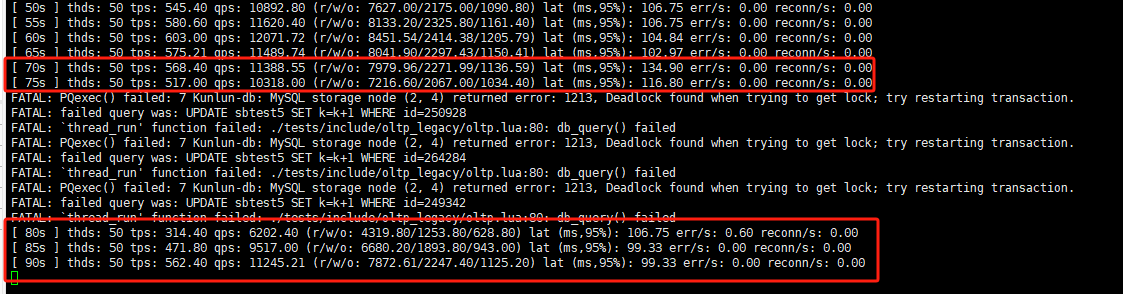
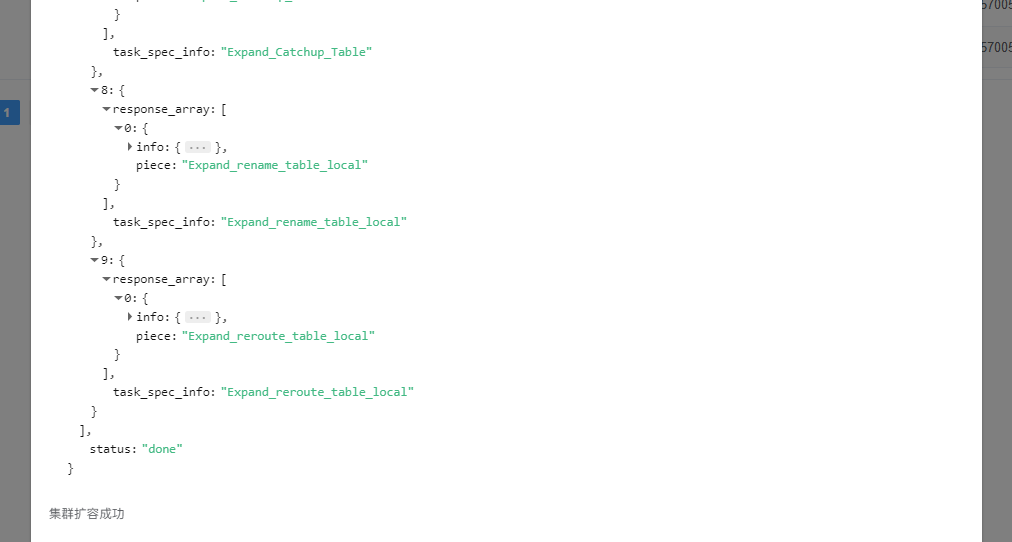
Compared to normal output, during the table migration process, there is a significant decrease in tps/qps by approximately 48% at its lowest point, without notable changes in latency. Additionally, although there were some business errors caught by sysbench due to the instantaneous change in table location during table migration, they were resolved after retries and did not lead to business interruption; the sysbench continues to run smoothly. In this output, it can be observed that tps/qps quickly returned to normal after the completion of table migration, and XPanel also provided a prompt indicating the completion of the table migration, as shown below:
2.5 Table Migration Flow Control Test
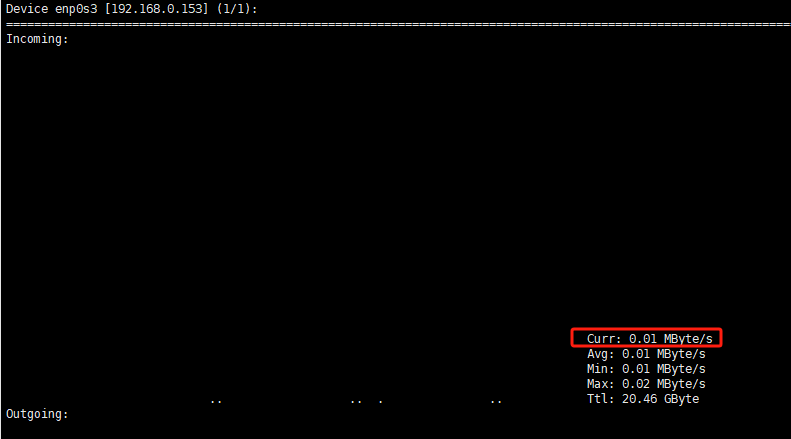
Open an SSH window on 192.168.0.153 and start monitoring network traffic by executing the following command:
nload enp0s3 -u m
The display in the window appears as follows:
Next, in XPanel, we proceed to migrate the table sbtest7, as illustrated:
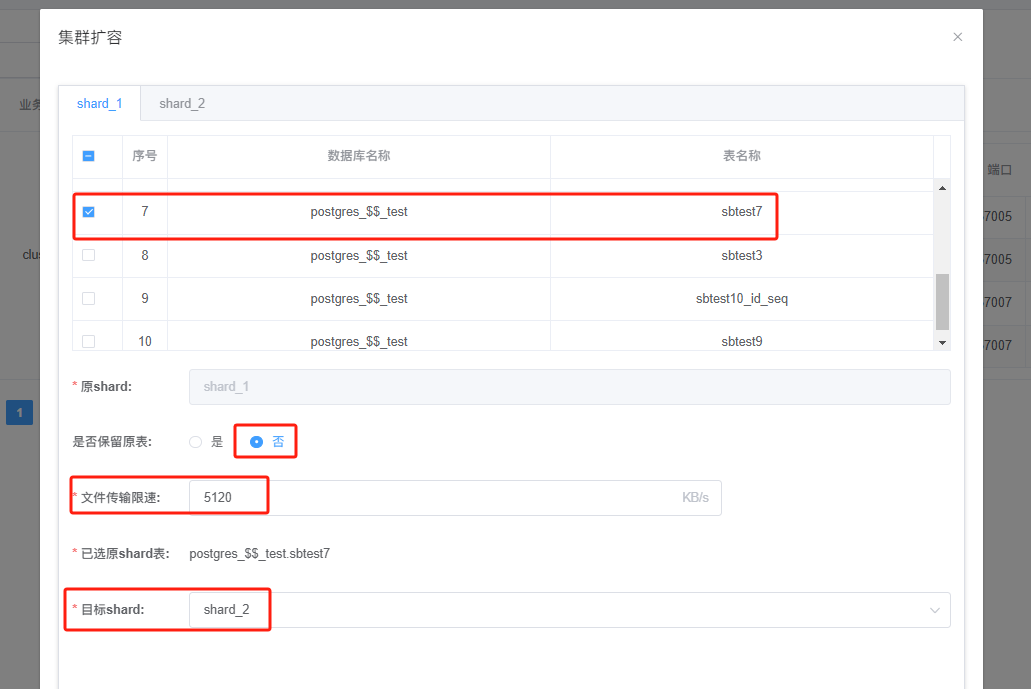
Note: Initially, we leave the "File Transfer Speed Limit" at its default value of 5120KB/s unchanged. Start the migration and time it with a stopwatch.
In the SSH window on 192.168.0.153, it's observed that the network throughput peaks around 5MB/s, validating the effective flow control by the 5120KB/s setting in the table migration parameters, as depicted:
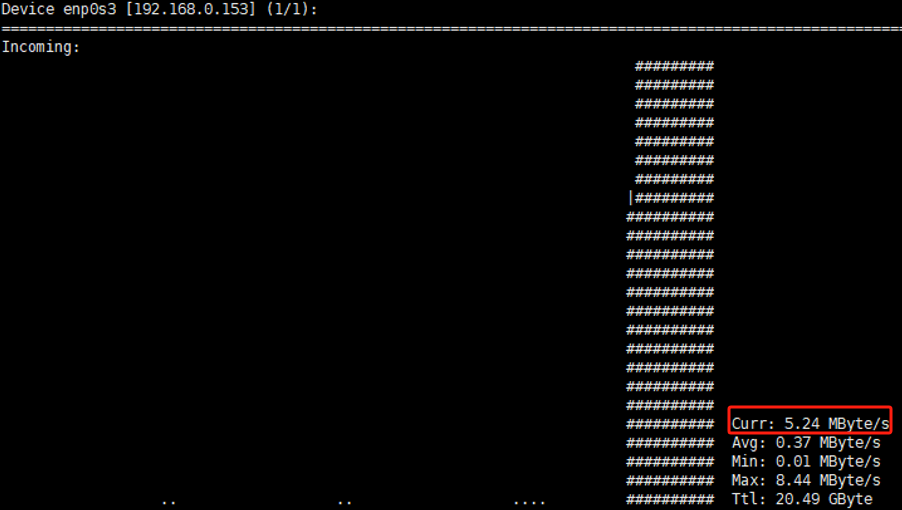
When XPanel confirms the successful migration of the table, the stopwatch indicates that the process took about 24 seconds.
Returning to XPanel, this time we choose to migrate sbtest3, as shown:
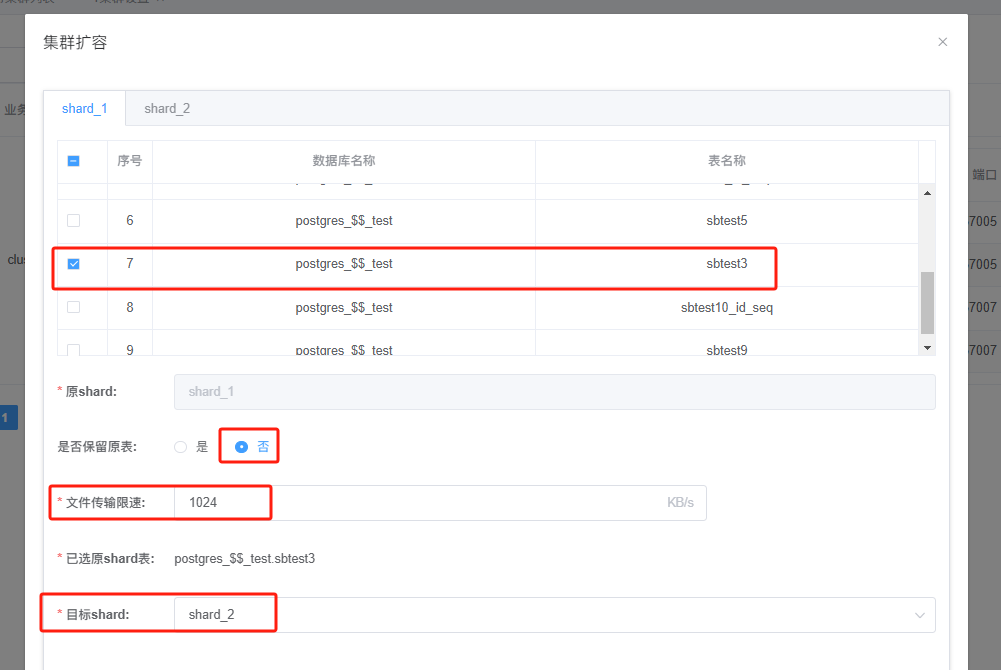
Note: This time we set the "File Transfer Speed Limit" to 1024KB/s and again time the migration with a stopwatch.
In the SSH window on 192.168.0.153, we can see that the network throughput peak is restricted to around 1MB/s, confirming that the 1024KB/s setting in the table migration parameters is effectively controlling the flow, as shown:
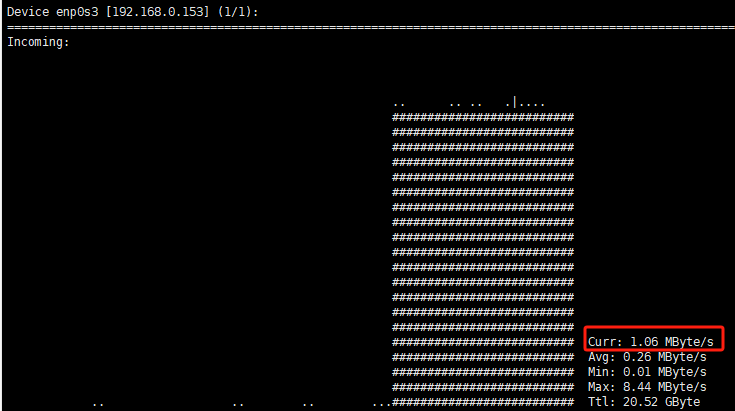
When XPanel signals the successful migration of the table, our stopwatch indicates that this migration took 60 seconds. These tests clearly demonstrate that the flow control parameter in the table migration settings precisely regulates the network bandwidth allocated for the task.