Klustron Execution Plan Explanation and Interpretation
Klustron Execution Plan Explanation and Interpretation
Note:
Unless specified otherwise, any version number mentioned in the text can be substituted with any released version number. For a list of all released versions, refer to Release_note.
Content of this article:
In Klustron, the execution plan refers to a detailed sequence of steps generated by the optimizer for executing an SQL query. Execution plans can help us understand the process of SQL execution, including the order of operations, the indices used, the type of joins employed, and so on. By analyzing the execution plan, we can identify performance bottlenecks in queries and optimize them. In this article, we'll interpret the execution plan of SQLs running in Klustron through specific examples.
01 Generation of the Execution Plan
The process of generating an execution plan in Klustron can be broken down into the following steps:
- Syntax Analysis: Parse the query statement into a syntax tree.
- Semantic Analysis: Analyze the syntax tree semantically, including resolving table names, column names, type checks, and more.
- Optimizer: Perform distributed query optimization on the query statement to generate the most efficient execution plan.
- Execution: Convert the optimized execution plan into executable code and then execute the distributed query by interacting with backend storage shards. The interaction method involves generating SQL statements for the relevant backend storage shards based on the requirements of the SQL statement and the distribution information of the table partitions on the backend shards.
In this process, the optimizer is the most crucial step. It selects the most efficient execution plan based on the characteristics of the query statement and the statistics of the related tables. The optimization process of the execution plan is quite intricate, encompassing choices such as the best join method, the optimal index selection, the most efficient sorting method, and more. With the assistance of the optimizer, Klustron can handle highly complex SQL statements while ensuring their performance.
02 Explain Syntax
In Klustron, the EXPLAIN command can be used to output the query plan of an SQL statement. Its specific syntax is as follows:
EXPLAIN [ ( option [, ...] ) ] statement
EXPLAIN [ ANALYZE ] [ VERBOSE ] statement

where option can be one of:

    ANALYZE [ boolean ]
    VERBOSE [ boolean ]
    COSTS [ boolean ]
    BUFFERS [ boolean ]
    TIMING [ boolean ]
    SUMMARY [ boolean ]
    FORMAT { TEXT | XML | JSON | YAML }
Details:
ANALYZE: When set to TRUE, it will actually execute the SQL and retrieve the corresponding query plan. It defaults to FALSE. If you need to optimize SQL statements that modify data and want to execute them without affecting existing data, you can encapsulate them in a transaction. After analysis, you can then roll back directly.
VERBOSE: When set to TRUE, it displays additional information about the query plan. It defaults to FALSE. This additional info includes output columns (Output) for each node in the query plan (explained further later), the SCHEMA information of the table, the SCHEMA info of functions, aliases of tables in expressions, names of triggered triggers, etc.
COSTS: When set to TRUE, it will show the estimated start-up cost (cost to get the first qualifying row) and total cost for each plan node, as well as the estimated row count and width per row. It defaults to TRUE.
TIMING: When set to TRUE, it will show the actual start time and total execution time for each plan node. It defaults to TRUE. This parameter can only be used with the ANALYZE parameter. As acquiring system time can be costly for some systems, you can turn this off if you only need an accurate row count without precise timings.
SUMMARY: When set to TRUE, it will output summary information after the query plan, such as the time taken to generate and execute the query plan. It defaults to TRUE when ANALYZE is enabled.
FORMAT: Specifies the output format, defaulting to TEXT. All output formats provide the same content, but XML, JSON, and YAML are more suited for programmatic parsing of the SQL query plan. For better readability, our examples below will use the TEXT format output.
Typically, the following method is used to execute SQL and generate detailed SQL execution information:
explain analyze verbose select … ;
03 Interpreting the Execution Plan
Klustron follows a computing-storage separation architecture, where SQL statements are parsed and execution plans are generated at the computing nodes, and data is then accessed at the storage nodes.
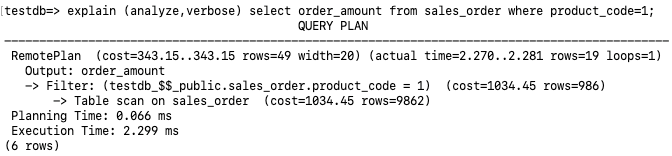
The output of the execution plan mainly includes the following sections:
- Access Method: RemotePlan is a new query plan node added by Klustron for retrieving user data from storage nodes. From the execution plan above, it can be inferred that this SQL statement is fully executed at the storage node with a Table scan access method. The filter condition at the storage node is
testdb_$$_public.sales_order.product_code = 1. - Access Cost: The estimated cost to execute the query is
cost=343.15..343.15. - Row Return Estimates: The estimated number of rows to be returned is
rows=49, while the actual number of rows returned isrows=19. The Table scan below estimates the total rows in thesales_ordertable asrows=9862. After filtering with(product_code=1), the estimated returned rows arerows=986. There's a discrepancy between the RemotePlan estimaterows=49and the post-filter estimaterows=986. This is because the row estimate for the RemotePlan is done at the computing node, while the operator and cost estimates underneath the RemotePlan are completed by the storage node, MySQL. Furthermore, under the analyze condition, the displayed MySQL execution plan steps don't include actual execution time. - Execution Time: The Planning Time section indicates the execution plan generation time was 0.066ms, while the Execution section indicates the actual execution time was 2.299ms.
3.1 Full Table Scan
Analyzing the previously mentioned execution plan, a Table scan on sales_order is performed at the storage node. During this full table scan, it also filters with (product_code=1). The actual execution time is 2.299ms, returning 19 rows.
3.2 Index Scan
3.2.1 Primary Key / Unique Index Single Row Scan
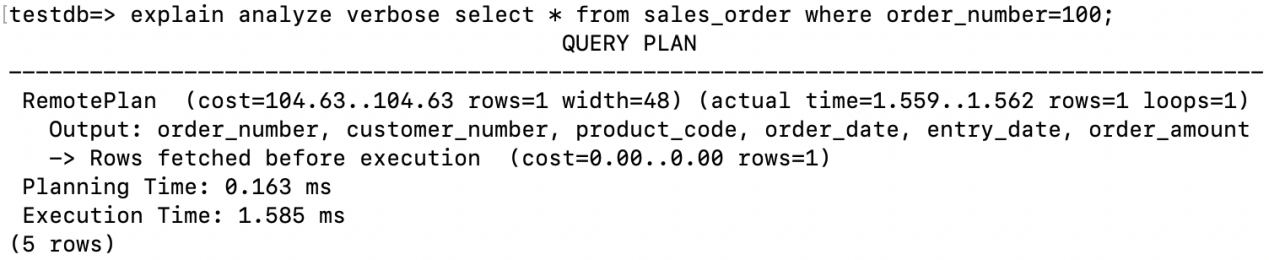
When accessing a single row using a primary key or a unique index, the execution plan will display Rows fetched before execution.
3.2.2 Index Lookup (Equality Condition)
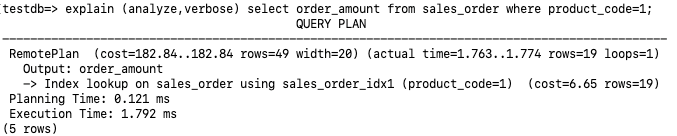
From the execution plan, an Index lookup on sales_order using sales_order_idx1 is performed at the storage node. The optimizer's estimate for this query seems accurate (cost=6.65 rows=19). The final execution time is 1.792ms.
3.2.3 Index Range Scan (Range Condition)
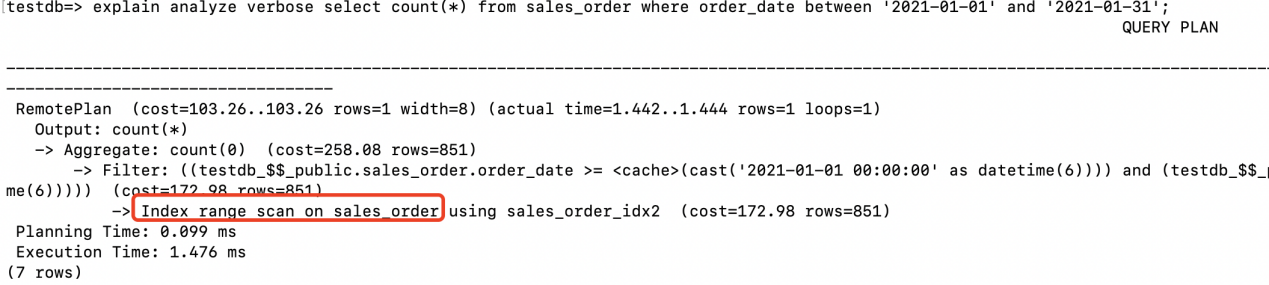
An index range scan is performed on the storage node's sales_order_idx2.
3.2.4 Index Scan

Since the returned fields are all contained within the index, an Index scan is performed at the storage node, scanning the entire index and avoiding the need to go back to the table.
3.3 Nested Loop Join
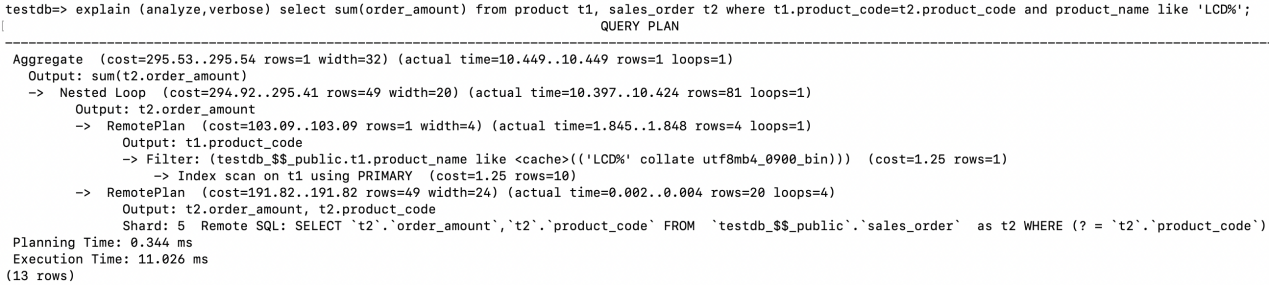
The specific execution steps are as follows:
- The driving table for the Nested Loop is
product, accessed via RemotePlan. An Index scan is performed on the primary key index at the storage node, filtering by the conditiont1.product_name like ‘LCD%’. Eventually, 4 records(rows=4)meeting this condition are returned to the computing node. - At the computing node, using the
product_codefrom each of the 4 records returned in step 1, a Remote SQL command is sent to the storage node:Remote SQL: SELECT t2.order_amount,t2.product_code FROM testdb_$$_public.sales_order as t2 WHERE (? = t2.product_code). This is looped 4 times(loops=4), with each result set sent back to the computing node. - The resulting dataset meeting the Join condition has 81 rows
(rows=81). - Finally, the SUM is completed at the computing node.
3.4 Hash Join
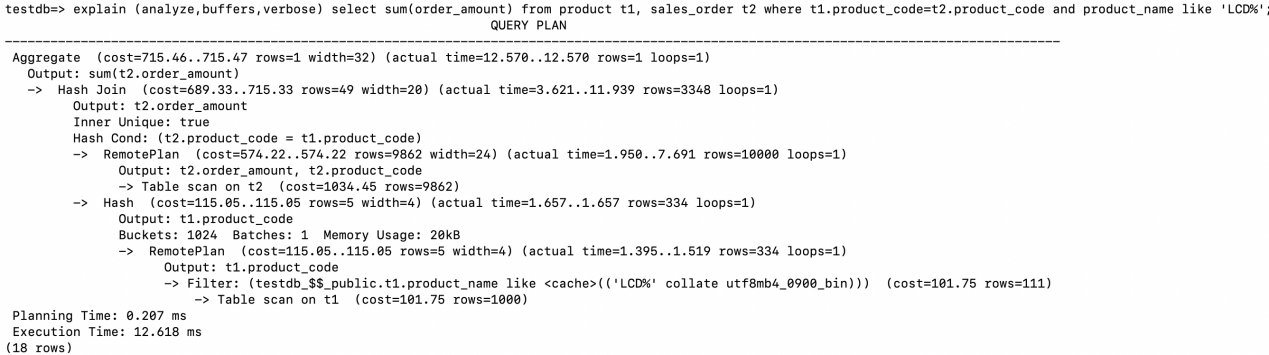
In the execution plan, the access to the driving table in Hash Join is in the lower half, which is different from the access to the driving table in the previous Nested Loop Join.
First, execute Table scan on t1 at the storage node, and filter (product_name like ‘LCD%’). Then, return the result set to the computing node.
On the computing node, create a Hash table based on the Join field. The Hash table situation is:
Buckets: 1024 Batches: 1 Memory Usage: 20kB
Execute Table scan to t2 at the storage node, and return the fields order_amount and product_code to the computing node.
Perform Hash Join on the computing node, probing the result set returned in step 3 with the Hash table created in step 2. Hash Cond: (t2.product_code = t1.product_code), returning order_amount values that meet the join condition.
Finally, perform the aggregation operation sum(order_amount).
3.5 Sort Merge Join
Typically, the connection efficiency of Hash Join is better than Sort Merge Join. However, if the row source has been sorted, no more sorting is needed when executing Sort Merge Join, making its performance superior to Hash Join. The join fields of the two tables below have created indices, so the results of the Index scan are already sorted and can directly be used as input for Sort Merge Join.
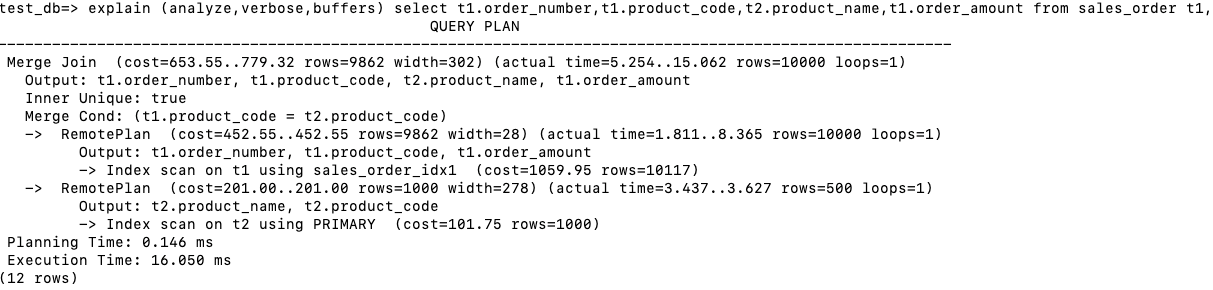
- Execute Index scan on t1 at the storage node, and after going back to the table, return product_code, order_amount, and order_number.
- Execute Index scan on t2 at the storage node, and after going back to the table, return product_code and product_name.
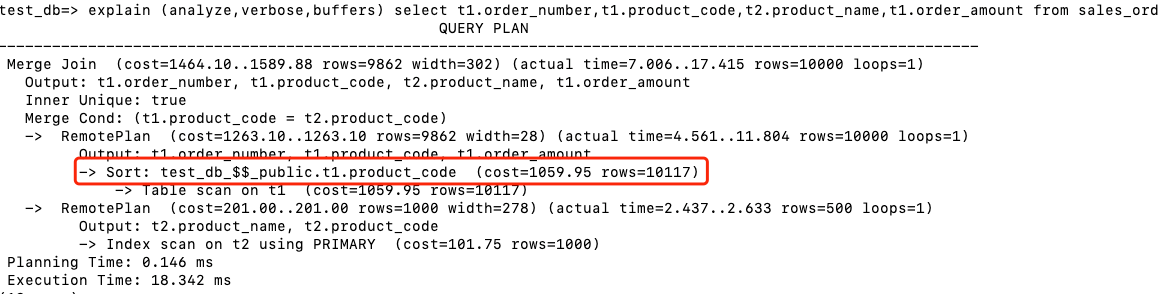
- Perform Merge Join on the computing node. Note that since the results returned by the Index are sorted by product_code, the Sort step is omitted.
If the product_code index of one of the tables is removed, the following execution plan appears, with an additional Sort step.
3.6 Parallel Execution Plan
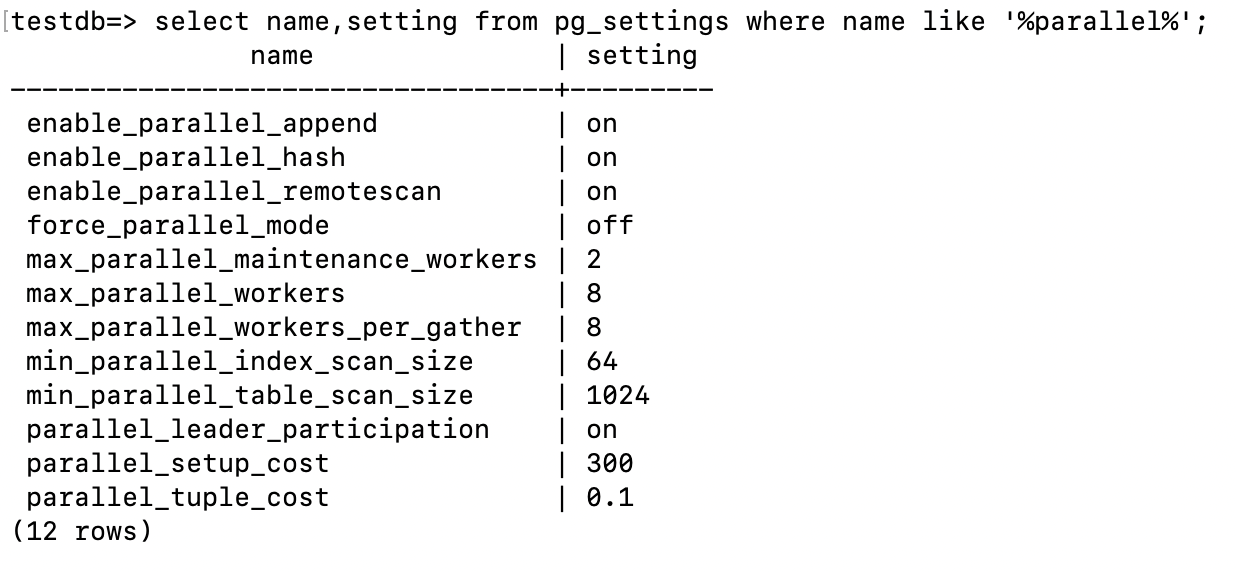
After turning on enable_parallel_remotescan in Klustron, the optimizer of the computing node can not only assign the RemotePlan of scanning different table partitions to multiple subtasks, allowing multiple worker processes to execute in parallel, but also split the RemotePlan of scanning a single table partition or unpartitioned single table into multiple subtasks based on statistical information. This way, even if the RemotePlan needs to scan a non-partitioned table, it can still execute in parallel.
View the parameters related to parallel execution on the computing node:
Let's take a look at the execution plan of distributed parallel queries.
3.6.1 Non-partitioned Table Parallel Scan
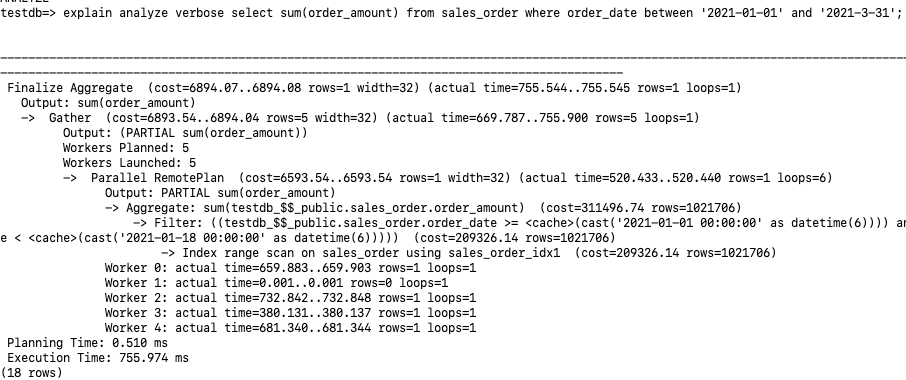
We see Workers Planned:5 Workers Launched:5. In fact, a total of 6 parallel processes are allocated: Leader, Worker 0-4. The loops=6 at the end of the Parallel RemotePlan also indicates 6 parallels.
Each parallel process on the storage node executed an Index range scan on sales_order using sales_order_idx1, performing their sum(order_amount) individually, and outputting PARTIAL sum(order_amount) results to the computing node. Since it's a partial result set aggregation, there's the label "PARTIAL".
The Leader process gathers the results of the other 5 sum(order_amount), then performs the final aggregation.

3.6.2 Partitioned Table Parallel Scan
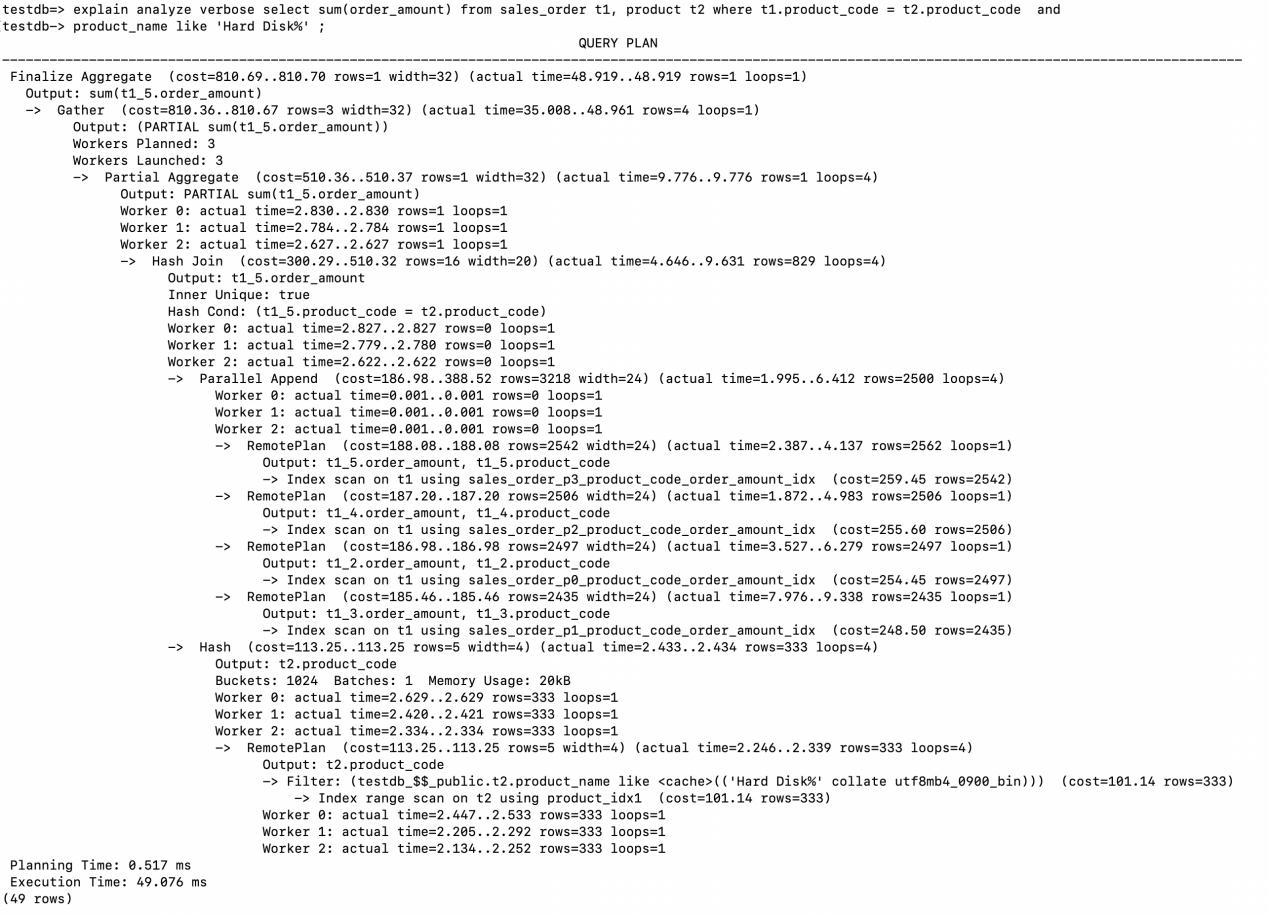
Similarly, we see Workers Planned:3, Workers Launched:3, but there are a total of 4 parallel working processes: Leader, Worker 0, Worker 1, Worker 2. Also, from loops=4, we can infer some clues.
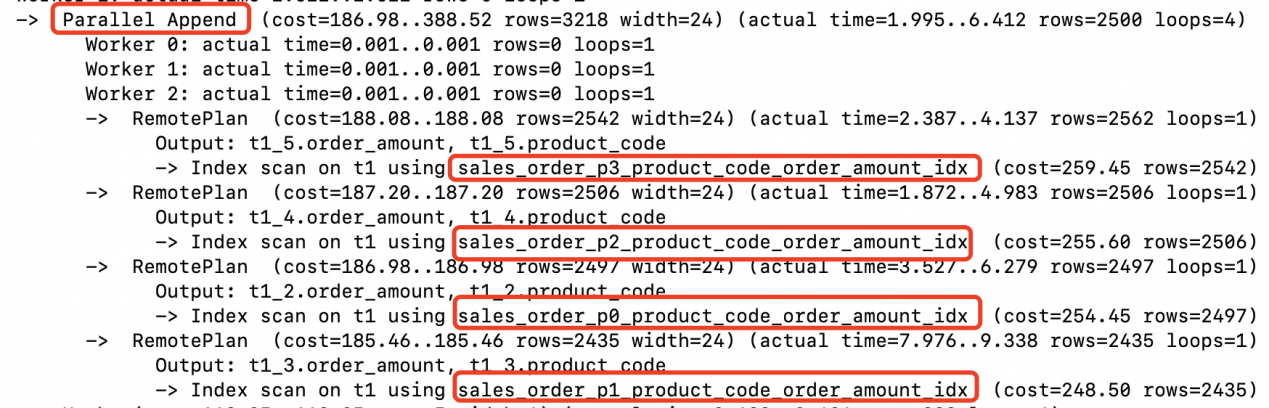
The two tables use Hash Join for joining. The driving table product is a non-partitioned table. All 4 parallel processes on the storage node performed an Index range scan on the product table. The resulting set meeting the conditions has 333 rows and is returned to the computing node to create a Hash Table.

- Parallel Append indicates that the sales_order's 4 index partitions were Index Scanned in parallel. The records meeting the conditions are returned to the computing node. (2562+2506+2497+2435)
- Hash Join is completed in parallel on the computing node.

Partial Aggregate performs aggregation operations on the rows returned by each parallel worker's Hash Join.
Gather collects the results returned by each worker process. The leader process executes Gather and the parts above Gather. Gather needs to deliver the result set to Finalize Aggregate to form the final output from each worker's Partial Aggregate results.

The RemotePlan of parallel execution will connect to the storage node to execute query tasks in each worker process. To get consistent query results, these worker processes must use the same snapshot in their respective connections. Therefore, Klustron has added the ability to share connection snapshots at the storage node level to cooperate with the computing node to execute parallel distributed query plans.
3.7 Presentation of Operator Pushdown in the Execution Plan
Klustron supports pushing down various types of operators to storage nodes for execution. Referring to the example of parallel execution of a large table in the previous section, operator pushdown can fully utilize the computing capabilities of the underlying multiple storage nodes. The pushdown functionality is demonstrated below through specific execution plans.
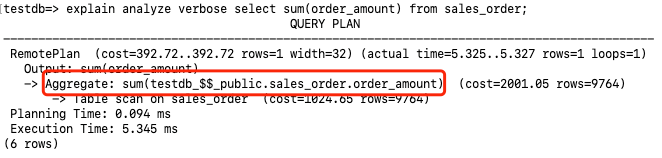
3.7.1 Aggregation Function Pushdown
Aggregation functions are pushed down to the storage nodes for execution.
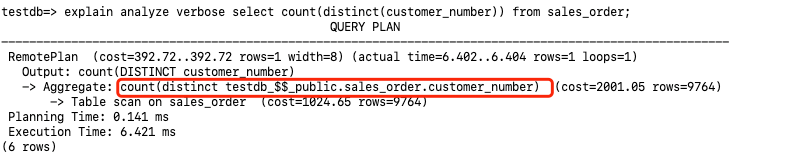
3.7.2 Distinct Operator Pushdown
The following execution plan pushes down the count(distinct customer_number) to the storage nodes for execution.
3.7.3 Limit and Order by Pushdown
The execution plan below shows that order by order_amount desc limit 10 are all pushed down to the storage nodes for execution.

3.7.4 Join Pushdown
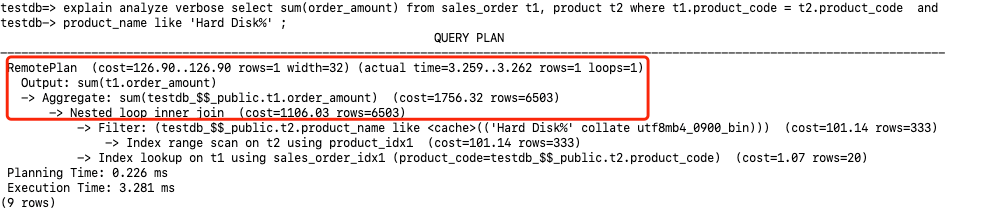
The following execution plan demonstrates pushing down the Nested Loop Join operation between the sales_order and product tables to the storage nodes for execution.